Data Dive is AR Insider’s weekly dive into the latest spatial computing figures. Running Mondays, it includes data points, narrative insights and takeaways. For an indexed collection of data and reports, subscribe to ARtillery Pro.
It’s time for another round of our periodic exercises to zero in on Oculus Quest unit sales. Given that it’s leading the way in VR headset sales (despite supply-chain constraints), it’s an important indicator for overall VR market revenue. It’s been the industry’s biggest beacon of hope to date.
As background, these exercises are compelled by the fact that companies in early-stage sectors like VR don’t disclose unit sales (except Sony). So we have to piece together clues from sources like public filings or periodic disclosures like content sales. Both happened recently for Quest.
We like to think of this like a Sudoku board: using known quantities to logically devise unknown ones. This is one of the many exercises and inputs that inform the official market sizing of our research arm ARtillery Intelligence. Until then, it’s just a thought exercise. Let’s dive in.
Exercise #1: Quarterly Earnings
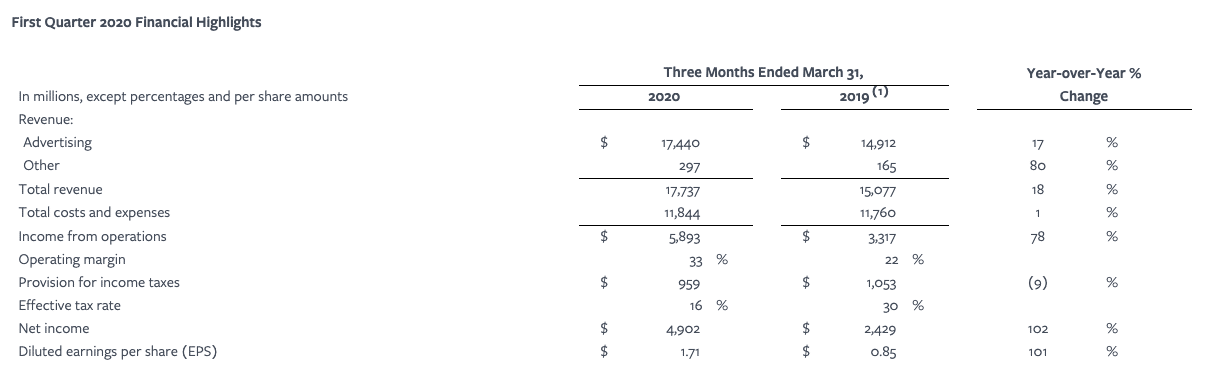
As mentioned, there were two recent clues from Oculus. The first is Facebook’s Q1 quarterly earnings. The company revealed that non-advertising revenues were up 80 percent year-over-year, fueled by Oculus. This is the exact period (starting Q2 2019) of Quest’s tenure.
So given that Q1 2019 was the last quarter not containing Quest revenue, the year over year delta for Q1 2020 can be attributed to Quest. That delta is $132 million. Estimating Quest’s 90 percent share — the rest being growth in other areas like Go and Rift, we get $119 million.
But to get to a hardware sales figure, we have to extract software sales. As we calculated recently, 2019 full-year software sales for Quest were $35 million, which takes into account 7 months of sales runway (late May release). We can use that to estimate Q1 Quest software sales.
Software sales to date, as we’ll cover below, are $100 million. Subtracting 2019’s $35 million means that the first 5 months of 2020 saw software sales of $65 million. So based on software sales growth and pacing, we can estimate that Q1 2020 software sales were roughly $30 million.
Subtracting that from the $119 million calculated above for Q1 Quest revenue gets us a hardware total of $89 million, or 209,411 units sold in Q1.* Adding that to the 424,242 that we previously calculated for full-year 2019 gives us a cumulative total (ending March) of 633,653 units.
Or boiling it all down…
(($132,000,000 *.9)-($30,000,000))+ (242,242)= 633,653 units sold (May ’19- March ’20)
*Oculus Quest base model (64GB) is $399 while the 128GM model is $499. This averages out at $449, but we’ve reduced Oculus’ ARPU to $429 due to weighted sales for the base model (common for new hardware). Reseller markups and price gouging aren’t included.
Excercise#2: Content Sales
The second clue was the recent announcement that Quest has sold $100 million in content/games since it launched last May. As we’ve done a few times in the past, we can back into unit sales using formula inputs such as average price-per-game and games-per-user.
There’s evidence that the average Quest game price is $25. In past exercises we’ve estimated the average game purchases per headset at 3. Given more time in market and accumulated game libraries per headset, we’ll increase that to 5: Some buy 7, some buy 3, and outliers loom.
This puts the average software/games spend per headset at $125. Bringing the software spend total back into the equation, we can extrapolate cumulative units sold at 800,000. One important distinction is that this is the cumulative total to date, versus exercise 1’s total through March.
($100,000,000/(5*$25) = 800,000 units sold (May’19 – May ’20).
Both exercises land in approximately the same place, if adjusted for their varying timeframes. The question that remains is what we can expect for full-year 2020. ARtillery Intelligence calculations (which were on target for 2019), estimate Quest 2020 annual unit sales at 1.1 million.
The disclaimer here is that the figures were completed in November before a pandemic and global lockdown impeded the hardware supply chain. Figures will be adjusted accordingly, and with the benefit of all of the above market signals that have since come to light.
Thought Excercise
Coming full circle, we’ll reiterate that this is a thought exercise. It’s not an official Oculus figure, nor an official figure from AR Insider and its research arm ARtillery Intelligence. It’s about extrapolating ranges for a better sense of VR market levels, and to inform official figures to come.
Given the challenge of market sizing without first-party data from VR hardware providers, it’s about constantly collecting clues like this, and building smart financial models. In an early and dynamic market (and a dynamic world), this will continue to be a moving target.
We’ll continue our unhealthy obsession with assembling reliable inputs and reporting back what we find. Tracking these clues is important, not just to help buttress the market-sizing of our research arm, but to impart an ongoing sense of VR traction and its strategic implications.