Industry rhetoric about AR’s world-changing status sometimes outweighs evidence that it’s captivating consumers today. Though we see some signals, such as lens engagement figures from Snapchat and others, we’re often “flying blind” when it comes to consumer AR sentiment.
Looking to fill that gap, AR Insider’s research arm ARtillery Intelligence has completed Wave V of its annual consumer survey report. Working with consumer survey specialist Thrive Analytics, it wrote questions to be fielded to 102,000+ U.S. adults and produced a report based on the results.
Known as AR Usage & Consumer Attitudes, Wave V, it follows similar reports over the last few years. Five waves of research now bring new insights and trend data to light. And all five waves represent a collective six-digit sum of U.S. adults for robust longitudinal analysis.
Among the topics: How is mobile AR resonating with everyday consumers? How often are they using it? How satisfied are they? What types of experiences do they like most? How much are they willing to pay for it? And for those who aren’t interested in mobile AR….why not?
Gradual Growth
Diving into these questions and starting at the top, what’s mobile AR’s overall penetration and adoption? This year’s survey results peg it at 30 percent of U.S. adults. This is up from 29 percent in Wave IV of the study, indicating positive – though somewhat flat – movement.
In fact, breaking the 30-percent barrier for the first time this year signals a combination of healthy traction and headroom to grow. AR is still in early stages of its industry lifecycle, and we expect usage to accelerate as consumer comfort levels – and the technology itself – advance.
As for who these users are, demographically speaking, they skew male, younger, and middle class. Specifically, 58 percent of AR users are 18-34 years old, 54 percent are male, and 51 percent have annual household incomes between $25,000 and $75,000.
Another question is how this penetration translates to market size. Applying the above 30 percent figure to the U.S. adult population indicates that roughly 98.3 million adults have tried AR, up from 94.5 million last year. This represents positive – but, again, gradual – growth.
To pause for definitions, these totals measure U.S. adults who have used AR at least once. This broad definition lets us start with a baseline, then drill down. For example, how do these overall usage figures break down by frequency? That’s always a key marker for consumer traction.
Health Indicator
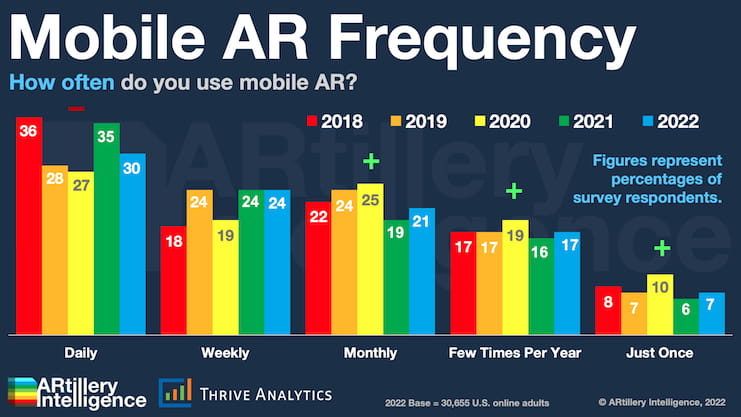
Drilling down, 75 percent of mobile AR users are active at least monthly, 54 percent at least weekly, and 30 percent daily. When we say “at least monthly” it includes respondents who claim daily or weekly use, as one or more activations monthly (MAU) is a common metric.
In any case, these are high figures by mobile app standards, indicating that active-use challenges in mobile apps (think: overcrowded app stores) aren’t as pronounced in AR. Furthermore, monthly active use grew in this survey wave, though daily use declined (see above).
Why is all this important? As noted, frequency is a key health indicator for mobile apps. In AR specifically, relatively short sessions (due to arm fatigue) need to be counterbalanced by high frequency. So the name of the game is to instill replayability in any AR experience.
For example, mobile AR experiences that fuse the novelty of augmentation with frequent or repeatable activities show the most potential. These “sticky” behaviors include social messaging, gaming, and utilities like visual search. These activities naturally happen daily or more.
We’ll pick things up there in the next installment of this series, including the formats (apps, web, etc.) and content categories (games, social, utilities, etc.) that resonate most with consumers…