AR continues to evolve and take shape as an industry. Prominent sectors include industrial AR, social, gaming, and shopping. But existing alongside them is AR advertising. This includes paid/sponsored AR lenses that let consumers visualize products on “spaces & faces.”
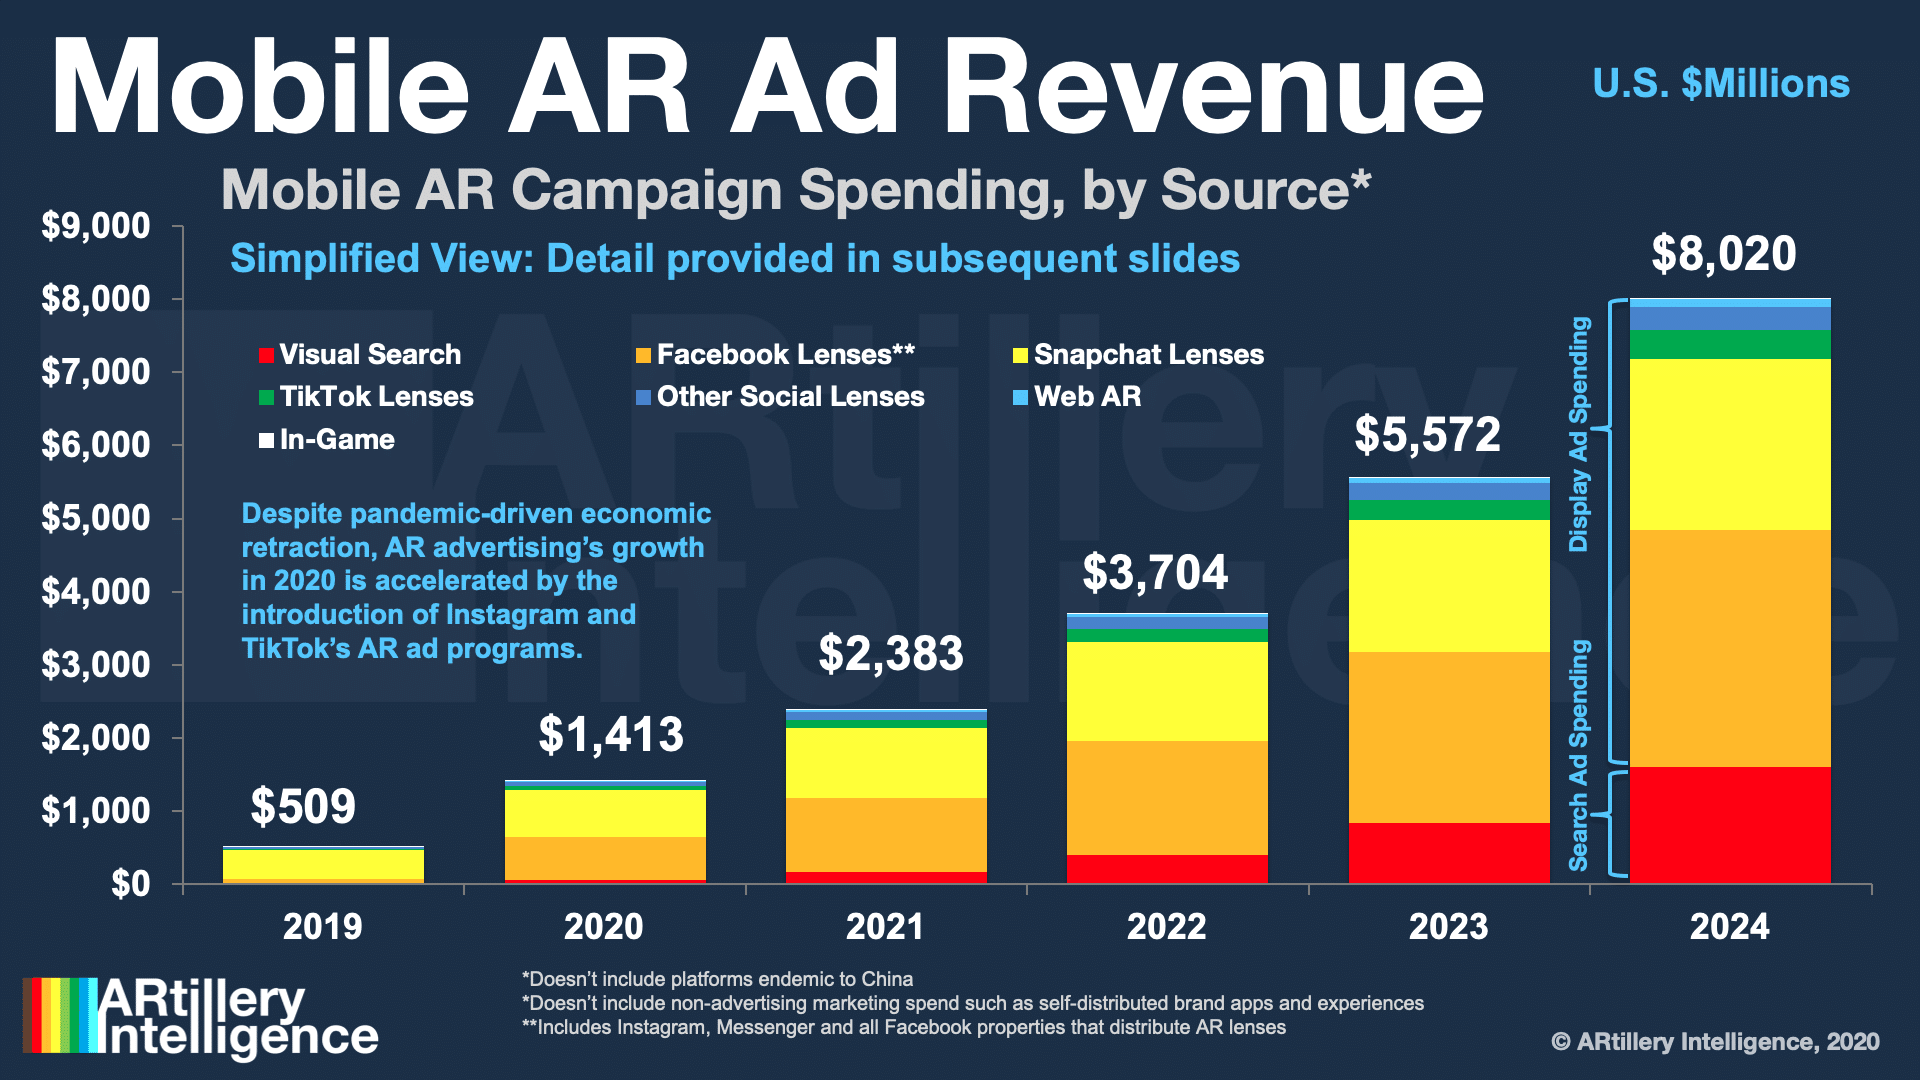
Advertising is one of the most lucrative AR subsectors, estimated to reach $1.41 billion last year and $8.02 billion by 2024. These figures measure the money spent on sponsored AR experiences with paid distribution on networks like Facebook and Snapchat.
As our research arm ARtillery Intelligence examined in a recent report on AR advertising, adoption drivers include brand advertisers’ growing affinity for AR. Its ability to demonstrate products in 3D resonates with their creative sensibilities, transcending common 2D formats.
To continue the narrative and “show rather than tell,” part II of that report features case studies that map to various stages of the consumer purchase funnel. What do AR ads look like today, what’s the concrete ROI, and what are strategic takeaways for campaign execution?
Measurable Outcome
After case studies that focused on upper and mid-funnel, we now continue to the lower funnel. These campaigns drive quantifiable consumer purchases through AR product visualization. This usually involves AR experiences that are integrated into a shopping and transactional flow.
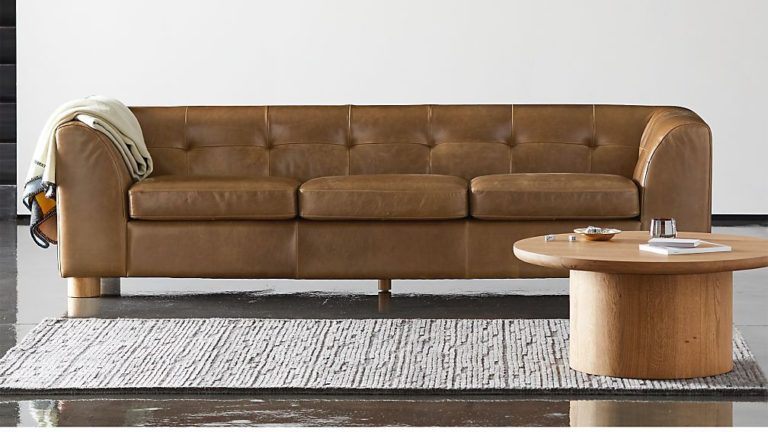
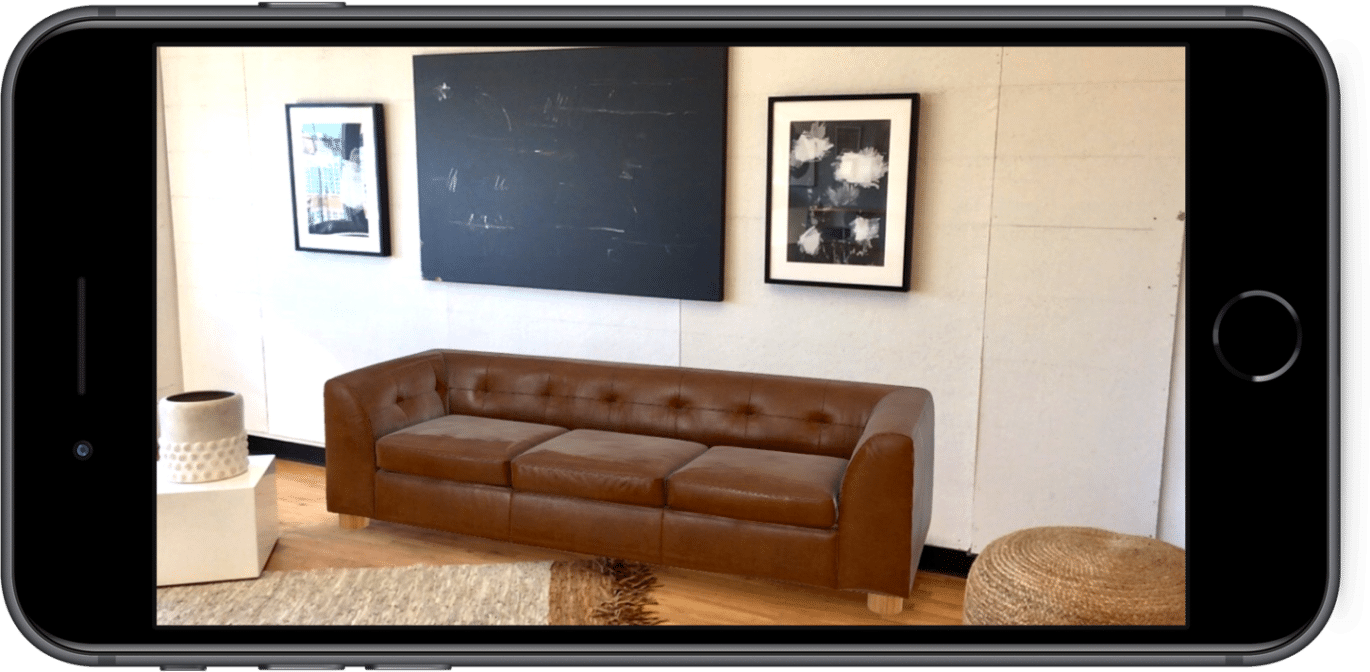
More evidence from the lower-funnel side of the AR commerce spectrum comes from CB2. The millennial-focused furniture retailer worked with Vertebrae to help customers visualize furniture through AR on their smartphones. The functionality was added to its mobile website.
This kicked off with CB2’s menswear-inspired GQ furniture line. Users could visualize furniture in their space through AR. This involved 3D models of large items, which continues to be a challenge for furniture-based AR commerce — especially for large product catalogs.
But CB2 is motivated to get there, based on the validation it already sees. Vertebrae’s preliminary data shows that products visualized through the AR feature saw 7 percent average conversion boosts, 21 percent greater revenue per visit, and 13 percent greater average order value.
Lessons & Learnings
In examining how CB2 achieved the above performance metrics, it’s partly due to AR’s inherent ability to engender more informed consumer purchases. But there are a few other tactics it applied that are worth extracting in terms of best practices and transferable lessons.
For one, it’s notable that just like Ally Bank’s campaign that we examined, CB2 chose web AR as a vessel. The thought is that AR is too early and unproven to justify typical app friction. AR’s need for a quick & dynamic experience is better aligned with the mobile web’s easier access.
Moreover, CB2 did its homework to determine that web AR is more aligned with how its customers specifically engage — both at home and in-store. Specifically, CB2’s VP of marketing Samie Barr told Furniture Today that half the site’s traffic comes from mobile web users.
Launching and testing AR with the GQ product line was also deliberate. CB2’s research showed that the furniture line’s male target audience generally has less familiarity with interior design or space planning. In other words, it’s a good product/market fit for AR visualization.
It’s also worth noting that CB2’s campaign involves rear-facing camera AR. Most AR traction we’ve seen is for front-facing AR (sunglasses, cosmetics), but the broader canvas of the physical world is a larger opportunity. That includes cars and couches today but could expand significantly.