
Data Dive is AR Insider’s weekly dive into the latest spatial computing figures. Running Mondays, it includes data points, narrative insights and takeaways. For an indexed collection of data and reports, subscribe to ARtillery Pro.
One of AR’s rally cries is its ability to boost conversion rates when applied to product visualization in eCommerce. The thought is that it enables more informed purchases through dimensionally-accurate product-visualization on “faces & spaces” as we like to say.
Though this AR advantage is oft-cited, data points to validate it are spread out among case studies, pitch decks and conference presentations. So for this week’s data dive, we’re continuing the exercise kicked off last week to aggregate and analyze AR-commerce performance data.
After covering conversion rates, we’re now circling back to tackle returns. In fact, the same “informed purchase” that drives conversion deltas can lessen return rates. It’s all about marrying e-commerce’s unit economics and digital advantages with IRL shopping’s “look & feel” benefits.
Why is this important? Returns are a $550 billion problem in the aggregate. And for companies like Amazon that operate on extremely thin margins, returns can cause quite a bottom-line blow. That pain point is amplified by bulky items that are expensive to ship, like couches and TVs.
Return on Investment
With that backdrop, what proof points are we seeing? The most notable validation comes from Shopify, given its operational scale. As reported by VNTANA’s Ashley Crowder in a recent presentation, Shopify has recorded a 40 percent decrease in returns from 3D visualization.
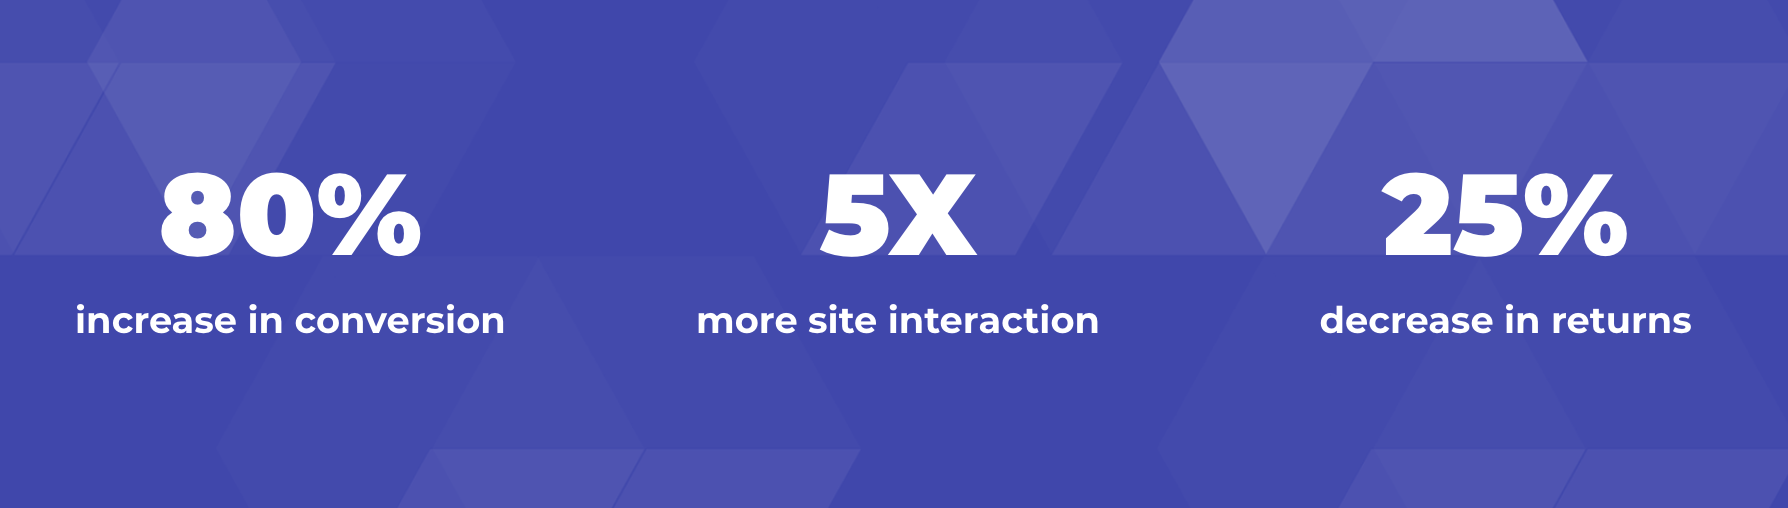
More validation comes from SeekXR, whose CEO John Cheney wrote recently in the pages of AR Insider that the company has measured a 25 percent decrease in returns from AR-guided purchases (see above). This comes directly from its work with large-scale e-tailers like Overstock.
Meanwhile, Build.com has reported that the return rate for shoppers that use its AR product visualization features is 22 percent lower than non-AR benchmarks. It devised this figure using A-B testing against a control group of people that bought the same products without AR.
Lastly, honorable mention goes to Macy’s. Using in-store VR (similar concept) it reduced returns to less than 2 percent. This is the absolute return rate (versus the return deltas shown above), but it’s notable in its deviation from industry-standard retail return rates of 5-7 percent.

Sustained Adoption
Beyond methodology and robust sample sizes, validation flows from consistency. Return rate deltas from the AR examples above are in the same 20-40 percent range. This variance can be expected, given purchase-consideration nuances across several product categories.
Either way, AR is proving its ability to improve margins and thus demonstrate a tangible business case. We should also acknowledge how this maps to the current state of the world. These advantages are evident in “normal” times but could be amplified during a pandemic.
As with events and remote work, AR is being given the chance to shine at a time when physical shopping is constrained. Evidence can be seen in Snapchat’s Covid-Era AR lifts, as well as L’oreal’s eCommerce boost, driven by AR-based cosmetics try-ons.
The ultimate question is if forced adoption during this period will instill positive and permanent consumer habits. In other words, those eager to buy couches and TV without risking virus-contraction may discover AR and find that they like it… thus inflecting its sustained adoption.
Header Image Credit: IKEA